Search CompSci.ca
Subscribe
Programming
Data visualization: programming an art piece
Computer programming is art. Not just because it takes a creative mind to unambiguously express a software solution, but also because of so much potential for a creative expression of the result. Enter data visualization, a process of conveying large amounts of complex information in a graphical form. Modeled to display easily recognizable patterns and facilitate easier discovery of trends. It is often a programmer’s job to handle large data streams, and to perform complex organizational computations. Though a well designed visualization does not only show off its data, but often itself as a whole. As a piece of art.
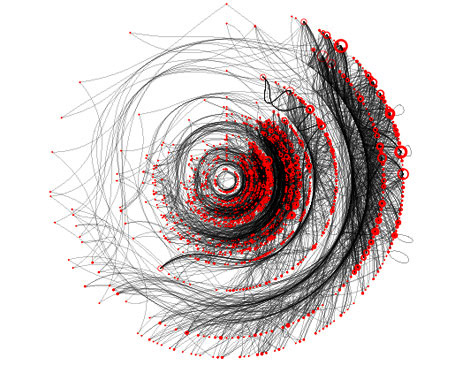
A beautiful visualizations of the poetry texts. Each word corresponded to a numerical code by adding the alphabetical values of its letters together. This number was mapped onto the position on a circle, and marked by a red dot. Gray lines connect the dots in the sequence the words appear in the poem.
PingMag, a Tokyo-based magazine about “Design and Making Things”, has recently published a post on the beauty of data visualization. Digging through piles of boring charts, there are a few rare gems of absolute awe, and Andrew Vande Moere (with whom the PingMag had an interview) shared his experience to locate the better ones. In a symbiosis of creative design and data visualization, piles of statistics are turned into pieces of art. Andrew explains:
Information aesthetic visualizations should appeal both the mind and soul. While they positively stimulate our senses, in terms of engagement, involvement, and imagination, they are also optimized for the specific task of conveying complex data-driven concepts in intuitive and easily comprehensible ways. It is not a surprise then, that the most successful infographics use creative design insights.
In fact, the blend between art and function is so great, that there are data visualization galleries that showcase exceptional works. Visual Complexity, for example, intends to be a unified resource space for anyone interested in the visualization of complex networks. There are some stunning examples, especially in the realm of plotting social interactions.
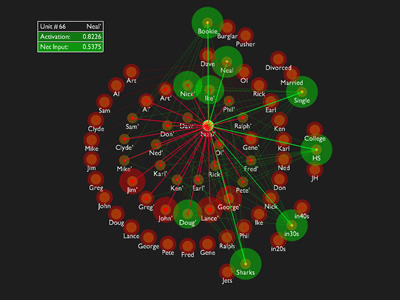
The [above] model was a landmark illustration of how simple networks of interconnected elements (artificial neurons, so to speak) can be organized so as to form a memory system that exhibits several crucial properties of human memory.
A popular programming language for many data visualization models (including the above neural network) is Processing – a Java based language that is very simple to use, and lets one focus on the media and its interaction, rather than worry about the details of the rendering process. It is fairly fun to play with, and the resulting Java applets are web enabled for easy sharing and demonstrations.
Remember the beauty of simple software. Yes, computer programming is definitely art. Wouldn’t you agree?
Read more
Discussion
Post a comment

This work is licensed under a Creative Commons Attribution-Noncommercial-Share Alike 3.0 Unported License.


I’ve always been mesmerized by complex graphs and graphical representations of various things. Cellular automata has been a part of my long-term project for the past 3 years, and I always find looking at the visualizations stunning. This summer I’ll be continuing that work on a grander scale, so hopefully I’ll having some fun screenshots to share.
Thanks for pointing out Processing, I hadn’t heard of it and it looks very flexible. Good to know of.
-h
Reply to comment
You might like this blog: http://infosthetics.com/
Reply to comment
hthth – I’d be checking my RSS feeds, but ping me with screenshots anyways, just to make sure
engtech – that is actually Andrew’s blog, and it’s already linked to in the article body
Reply to comment